CCIPD has been one of the leading research groups in developing novel computerized image analytic methods for disease diagnosis and prognosis in prostate, breast, oropharyngeal, colon histopathology; with a focus on developing integrated pipelines that can yield greater insights than currently possible.
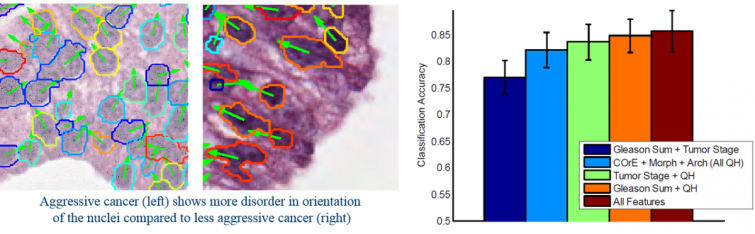
Cell Orientation Entropy (COrE): Predicting Biochemical Recurrence from Prostate Cancer Tissue Microarrays: We introduce a novel feature descriptor to describe cancer cells called Cell Orientation Entropy (COrE). The main objective of this work is to employ COrE to quantitatively model disorder of cell/nuclear orientation within local neighborhoods and evaluate whether these measurements of directional disorder are correlated with biochemical recurrence (BCR) in prostate cancer (CaP) patients. COrE is the first rigorous attempt to quantitatively model cell/nuclear orientation. We evaluated the ability of 39 COrE features to capture the characteristics of cell orientation in CaP tissue microarray (TMA) images in order to predict 10 year BCR in men with CaP following radical prostatectomy.
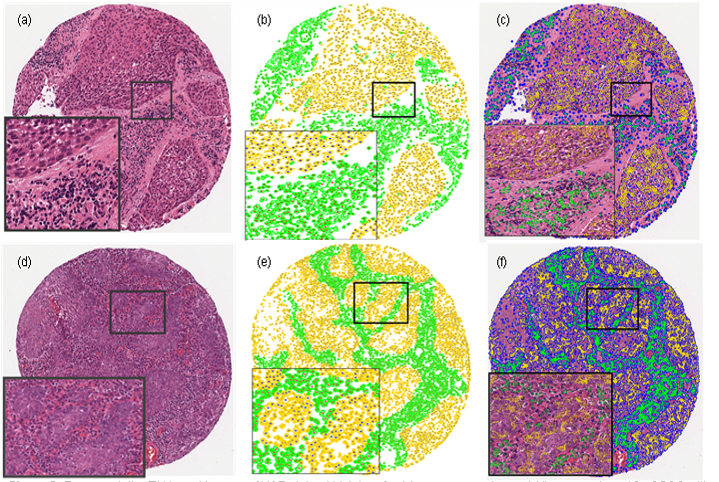
Spatially Aware Cell Cluster(SpACCl) Graphs: Predicting Outcome in Oropharyngeal p16+Tumors: We present a new spatially aware cell cluster (SpACCl) graph that can efficiently and accurately model local nuclear interactions, separately within the stromal and epithelial regions alone. The SpACCl graph allows for exploration of (a) contribution of nuclear arrangement within the stromal and epithelial regions separately and (b) combined contribution of stromal and epithelial nuclear architecture in predicting disease aggressiveness and patient outcome. In a cohort of 160 p16+ oropharyngeal tumors (141 non-progressors and 19 progressors), a support vector machine (SVM) classifier in conjunction with 7 graph features extracted from the SpACCl graph yielded a mean accuracy of over 90% in distinguishing between progressors and non-progressors. Figure depicts Representative TMA spot images of H&E stained histology for (a) non-progressing and (d) progressing p16+ OSCC with (b), (e) associated cell cluster identification with epithelium nodes in yellow, and stromal nuclei in green and (c), (f) cell cluster graphs. Note differences in CCGs for the two classes of OSC (top versus bottom row).